April 29, 2015

Oysters and Pesticides: The Washington State Department of Ecology Stumbles

Change.org online petition to stop the pesticide spraying is here.  Also some WA State Ecology contact information.

This week Bloomberg News published a sobering story describing the use of pesticides in Northwest waters by the oyster industry.  Included in this story is the approval by the Washington State Department of Ecology of the insecticide imidacloprid, a potent neurotoxin, for spraying over Willapa Bay and Greys Harbor.  This toxin is known to kill bees and, according to the manufacturer should NOT be use in water:
“This product is highly toxic to aquatic invertebrates. Do not apply directly to water, or to areas where surface water is present or to intertidal areas below the mean high water mark.”
Today, Danny Westneat published a similar story in the Seattle Times.  

It is not like the environmental negligence of the powerful Washington State oyster industry was a mystery, with community groups such as ProtectOurShorelines describing the chemical stew and plastics spread over our public waterways by this industry.   Last year, I blogged about this issue when taking on some of the factual errors in the Seattle Times stories about ocean acidification.

This issue represents a major failure by the state agency responsible to protect Washington's environment (Washington State Department of Ecology).   It is an example of a wealthy industry getting its way, of cozy relationships with politicians, of incomplete information being provided to the State's citizens.


The Coalition to Save Puget Sound document to environmental predations of some in the local shellfish industry (link here)
There is a long history of oyster aquaculture here in the Northwest.   Native oysters (the Olympia oyster) were originally abundant until harvested to near extinction.   To replace it, local oystermen brought in the larger Pacific oyster from Japan, a species unable to spawn naturally in our local waters.  But a problem developed in the 1950s after fresh water flushing from Columbia River was reduced by dam construction and timber harvesting had degraded the quality of our coastal bays: native burrowing shrimp flourished in coastal bays.  Unfortunately, the burrowing churned up the tideflats and disrupted oyster growth.  And overfishing removed many of the predators for the little shrimp.

So the oystermen decided to use a powerful insecticide, Carbaryl, a neurotoxin and carcinogen.  It is highly toxic to human and animals. Amazingly, the State Department of Ecology allowed this.    

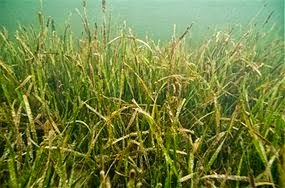
But there was another problem for the oystermen: extensive eelgrass, which was undermining the productivity of oyster beds.   The solution:  spraying an herbicide Imazamox over the coastal wetlands.  And AGAIN the Department of Ecology approved spraying a problematic chemical over our natural marine environment.

A number of environmentally concerned folks were worried about the Carbaryl use, and after substantial pressure, the oyster industry turned to another insecticide, one never used on water before in the U.S., imidacloprid, a chemical used in several home and agriculture pesticides.   Imidacloprid is considered dangerous to bees and is banned in Europe.  And guess what?  The Department of Ecology has given permission for its use in our coastal bays starting next month.
 This chemical is highly soluble in water and will spread in the water to fish and other wildlife.

Are you getting the idea that the Washington State Department of Ecology is more interested in protecting the bottom line of the oyster industry than protecting the health of Washington citizens and our natural environment?   You would not be alone.

And the bottom line of the oyster folks is doing very well, thank you.  Here are some interesting statistics from the Washington State Department of Fish and Wildlife of the number of pounds of unshelled oysters produced in Washington each year and the price per pound.  The harvest was level and the price QUADRUPLED (the reason is mainly because of loss of production in other parts of the world).   Someone is making a LOT of money.

Graphic courtesy of Todd Myers, WPC

So the oyster industry is making out like bandits, while the Seattle Times is writing stories about a crisis in oyster production due to ocean acidification.  As I described in detail in several of my previous blogs, the only oyster deaths were in factory oyster seed farms when they mistakenly took in cold, upwelled water during the summer.  Once they understood their mistake (with the help of the University of Washington and NOAA PMEL), the production of oyster larvae was stable and the industry is doing well.  Want proof?  Here is the price for oyster larvae the last few years:  rock solid.


There is no more prevalent untruth going around in the media and among some politicians than the claim that rising CO2 has been undermining oyster harvests during the past few years.  This statement is simply false.  And I have confirmed this with expert colleagues at the UW and NOAA PMEL

A question you might ask is why the Washington State Department of Ecology is allowing our precious waters to be turned into chemical dumping grounds for the sake of private sector interests?   One can start with jobs and money, with the Washington oyster industry bringing in nearly two-hundred million dollars a year and providing several thousand jobs.

But there is something else.  The supposed oyster/coastal acidification link is being used by some state politicians to support a political agenda dealing with greenhouse warming and rising CO2.  Several state politicians claim in speech and speech that the oyster issue is the  "canary in the coal mine" for CO2 and global warming.  Such politicians are often involved in photo-ops with oyster industry folks and clearly are not enthusiastic about restraining the activities of the local shellfish industry.  Global warming is a very serious issue for our region... it is counterproductive to hype the oyster connection to convince folks to reduce their carbon footprint.

 The oyster folks admit in private that rising CO2 is not currently an issue for them, but the claim in very useful in making them look environmentally progressive and attractive to those with a political agenda.   It also gives customers an inaccurate impression that oysters are rare and threatened, encouraging prices to rise.


Want to complain to the Department of Ecology before the new insecticide is sprayed along our coastal waters?   Contact your local state representative or call/email the head of the Department of Ecology Maia Bellon.  Email the Governor.

And you might think twice about ordering oysters in a restaurant or from your local market.

Finally, I should note there are other major environmental issues regarding the local shellfish industry.  For example, there is the massive use of PVC pipe and other plastics for geoduck production (see picture). Every acre of geoduck aquaculture includes approximately 8 miles of PVC tubes plus 40,000 plastic net caps, plastic bands and/or 30 x 30 ft. plastic canopy nets.


We are talking about a serious source of plastic pollution (more info here).

April 27, 2015

Is a Strong El Nino FINALLY coming?

Last year about this time, the media was abuzz about a Super El Nino that would hit over the past winter (2014-2015).  Dramatic predictions were made for drought in the Pacific Northwest and heavy rains over southern California.

Unfortunately for the prognosticators, an official El Nino didn't occur although the waters in the tropical Pacific were slightly above normal.   Perhaps, we should have called it El Tepid.

But during the last few months the situation has altered substantially with temperatures in the central and eastern tropical Pacific surging upwards.   NOAA and Australian forecasters are now saying we are in an official El Nino and it appears it will become moderate or strong this year.

Let me show the details.  Here are plots of the sea surface temperature (SST) anomalies (differences from normal) for four critical zones in the topical Pacific. They are warming, with many of them being the warmest over the past year.  The usual definition for El Nino calls for a warm anomaly in the Nino 3.4 area of at least .5C for three consecutive months.  We got that now.


Here is a map of the SST anomalies for the past month.  Warm water (dark orange and red) stretching from the central Pacific to the coast of S. America.   You can also see the crazy warm water off our coast.

 NOAA has placed a series of buoys along the equatorial Pacific to keep track of the ocean temperatures below the surface.  These buoys show quite warm water extending 100-200 meters beneath the surface.  This figure shows an east-west cross section across the central Pacific of the underwater temperatures.  Red is much warmer than normal.


Bottom line:  we have now entered El Nino territory.  Based on a collection of models, NOAA's Climate Prediction Center (CPC) is going for El Nino conditions the remainder of this year (see their probabilistic forecast below).   Roughly 70% chance  this summer and about 60% chance next winter.  But this time of the year you have to be careful, with the quality of the winter forecasts improves radically by July and August.


The National Weather Service's primary seasonal prediction system, CFSv2, is based on running  weather/ocean forecast models out 9 months.    Its forecast is emphatic and confident (see below):  a strong El Nino will develop this summer and extend into next winter.


So what are the implications for the Northwest if a strong El Nino is in place next winter?  

We tend to be warmer than normal with less snow in the mountains (and much less snow in the lowlands).  Less stormy.  The good thing is that a typical strong El Nino year generally has more snow than the freaky year we just finished.  But this is not good news for ski areas.   On the positive side, El Nino years tend to bring more precipitation than normal to central and southern California.   And guess what?  The latest NOAA CFS model is showing exactly that for next October through December (see below).
Let me stress that there is a lot of uncertainty with this forecast and the models were not good last year.  But this year's warm water is more extensive than last and the models are more in agreement.  If the forecasts hold into mid-summer, our confidence in the strong El Nino prediction will be substantially enhanced.  So hold on but you decide on buying that ski pass at your favorite resort.

April 25, 2015

Exploding Trees and Lightning

If you needed another reason to avoid standing under a tree during a lightning storm, here is another: the tree might explode and shred everything in its environment.

Such an event happened in the University of Washington Arboretum on March 31st and I visited the site this week during a run.....and I was amazed.   Here I am in front of the tree... this tall fir blew out form the center, with spokes of the trunk projecting out on the ground likes spokes of a bicycle wheel (picture taken by my colleague Lyatt Jaegle).


Another perspective:


 Branches and tree shrapnel was obvious HUNDREDS OF FEET from the tree.   Some of the wood was ejected so forcefully that it hit the ground and was deeply embedded--- over 100 feet away!   So deep I could not pull it out.


Here is a branch that pushed deep into the ground about 75 feet away.


A view from the air (courtesy of KOMO TV) and on the ground right after it happened (courtesy of the UW arboretum)  are shown below.  The original tree was over 100 ft tall.


Why did it explode?  When lightning hits the tree, it ran down the moist inner sapwood, since that portion of the tree conducts current better.   The huge current produced rapid heating and the water turned to steam, which in turn produced huge pressures that caused explosive expansion.

Can you imagine if you were standing near that tree?  You would have been torn apart or speared by flying debris.   Of course, standing under a tree during a thunderstorm is a bad idea for other reasons, such as getting electrocuted by the lightning current.   When I was a student at Cornell, a bunch of student were sheltering under a tree during a storm.  Lightning hit.  Several were seriously injured with some never recovering.

Want to see a video of lightning-caused tree explosion.   Check this out and look at the debris ejected over the parking lot.  This was a much smaller trees that the one shown above.


It turns out that cold can also cause trees to explode.  Water expands as it freezes (something I learned well when I put a full water bottle in the freezer), producing huge force.   So under very cold conditions the moist inner sapwood can freeze putting such a large force on the outer bark that the tree explodes.  The sound of such exploding trees supposedly sound like gunshots.   Native Americans such as the Sioux and the Cree sometimes called the first moon of the new year the "Moon of the Cold-Exploding Trees".    Don't worry, such cold does not occur here in western Washington.

And burning trees can exploded during wildfires when the sap is flammable, something that has been observed with eucalyptus trees in Australia.

Here in the Northwest, the big danger from trees is not the ones that explode, but rather the ones that fall during strong winds.  Big trees hugely increase the risks during windstorms and many people have been injured or killed in our region from falling trees and branches.  Big trees are a force multiplier for Northwest windstorms.

Don't get me wrong... I love trees.   But on rare occasions, danger lurks.

PS:  If you want to visit the exploded UW tree, it on on the north side of the UW arboretum, a few hundred feet northwest of the visitor center.

April 23, 2015

Wetter weather ahead for Friday and Saturday

In a year with low snowpack, getting rain during mid to late spring is crucial for reducing water problems during the summer.  The water delays the beginning of watering/irrigation season, leaving more water for later use.  And the water can go right into the region's reservoirs, which no longer have to worry about holding storage for potential flooding.

The past 24h brought a few tenths of an inch over the region, and nearly 3/4 of an inch over the windward side of the Olympics (see graphic).


And some wet prospects are ahead:   here is the National Weather Service GFS model forecast for cumulative rain over the next ten days. Western Washington and the Cascades do well, at least several inches, and even northern California gets moderate rain.


Friday and Saturday will be influenced by an upper-level trough that will maintain cool, unstable air over us (see upper level map for Friday morning),   Typical spring shower regime with low snow levels.

Looking at the next 72 hr precipitation over the Northwest from the UW WRF model, there is substantial rainfall ahead, with 1-2 inches of liquid water over the North Cascades and Olympics.


Perhaps more importantly, some of this precipitation will be mountain snow with 1-2 feet in portions of the north Cascades.


The latest extended forecast by the NOAA Climate Forecast System model (CFSv2) for the next three months is suggesting normal precipitation, except for right along the coast (see map).
I believe the media and some local politicians have gotten a bit too worried about our "drought."   We have not had a precipitation drought at all....we are in a snow drought due to warm temperatures.  The situation is unique and I suspect we will weather this summer far better than expected.  And for those looking for outdoor activities this weekend:  Sunday morning and early afternoon look the best.

April 21, 2015

The U.S. Air Force Turns to a Foreign Weather Forecasting System

The United States Air Force has decided to drop its American weather prediction system (the Weather Research and Forecasting model, WRF) for the forecasting system developed by the United Kingdom (UKMET Office Unified Model).

As described below, this decision is a terrible mistake and will ensure substantial damage to U.S. weather prediction capability, waste precious financial resources, and  undermine the U.S. Air Force's capacity to provide the best possible forecasts for U.S. pilots and Air Force operations.


This blog will tell you about this unfortunate situation, document a flawed decision-making process, describe the downside of this decision, and call for better-informed public officials and legislators to intervene.

The current situation

Today, the US Air Force makes regional forecasts around the world using the WRF model.  WRF is an extraordinary success story;  developed at the National Center For Atmospheric Research  (NCAR) in Boulder, Colorado, WRF is used by thousands of users in the U.S., and is the predominant model used in the research community and the private sector.  WRF is also heavily used by the National Weather Service and by many thousands of individuals, groups, and weather forecast entities around the world.    WRF is probably the best example of a community model: highly flexible, state of the art, adaptive, with advances from the research community flowing into the effort, resulting in constant improvement.


During the mid-2000s, the AF took on WRF as their main regional modeling tool, using the U.S. global GFS (Global Forecasting System) model for their global predictions.  The global model is used to provide boundary conditions for the regional model (WRF).

The AF adoption of WRF was a win-win for the nation.   AF funding contributed to maintaining and improving WRF; in fact, the AF was the largest financial supporter of WRF.   The AF in turn had the best possible regional model, one that was easy to use and highly capable, and a model that took advantage of the efforts of the vast U.S. weather research community.   An improved WRF helped drive U.S. weather modeling research and was taken on by many private sector firms.  The U.S. was clearly the world leader in this domain.

The Air Force fumbles

Late last year it became known the Air Force Weather Agency, which runs AF numerical forecast models, had decided to drop WRF and NOAA's GFS model, and turn to a foreign modeling system:  the UKMET office model.   A recent story in the Washington Post discussed this decision.   This decision was made without talking to U.S. national weather modeling partners (the National Weather Service and the U.S. Navy) and appears to be the decision of one individual, Ralph Stoffler, acting head of the Air Force Weather Agency.  Mr. Stoffler was an AF weather officer and has a BS in meteorology.

Ralph Stoffler

Checking with my contacts in the Air Force, I have learned that there were no long-term verification/comparison runs to demonstrate that the the UKMET office model would be superior to WRF.  It is stunning that such a major decision would be taken without strong evidence of improvement.

Mr. Stoffler's plan greatly expands AF modeling into the global arena, moving to DUPLICATE the U.S. global prediction efforts completed by the National Weather Service and the U.S. Navy's Fleet Numerical Meteorology and Oceanography Center.   There has always been an unfortunate relationship between Navy and Air Force weather operations, with substantial duplication of efforts.   But the new AF plan goes beyond this and is highly wasteful of U.S. weather prediction resources.

To run a state-of-the-art global model requires large resources, including the acquisition and quality control of vast amounts of data from many different satellites.  A high-resolution global model also demands huge computer resources. Clearly, Mr. Stoffler has not considered these issues in depth before proposing his new approach.

Let me underline the fact that there is no evidence that the UKMET office model is a superior regional model.  WRF has far more physics options and is much more widely tested at high resolution around the world.  UKMET Office global forecasts have slightly better verification scores in the Northern Hemisphere that the NOAA GFS, but these differences are small.   Furthermore, the NOAA GFS model is now undergoing rapid improvements (made possible by the new supercomputers NOAA is getting this year) and I suspect that by the end of 2016, the GFS will be as good, if not better, than UKMET.  Thus, the AF could well end up with an inferior global forecast.

But it is worse than that.   The UKMET office model is known to be difficult and unwieldy to use, and there will be a hugely expensive spin up at the AF to run this model and connect it to their production suite of products.  Resource demands in running a state of the science global model are huge. And as I have described in previous blogs, the U.S. has TOO MANY models running, resulting in division of effort and waste.  The AF is taking the wrong road.

But let's be honest here.  This situation is a warning to the National Weather Service and the U.S. weather modeling efforts---if the U.S. Air Force is making plans to use overseas modeling systems, this is not a good sign.

Major Impacts on WRF

Air Force funding has been critical for the viability of the national regional weather forecast system (WRF), the one used here at the University of Washington, by the way.   The AF has been the main Federal financial supporter of WRF.  The loss of AF funding will greatly undermine WRF and its future development (including the revolutionary global MPAS model that would be its successor).   WRF is the model used in many key forecasting systems in the U.S., such as the National Weather Service High Resolution Rapid Refresh system. The economic and scientific impacts of the AF action would be large and damaging to the U.S. weather prediction enterprise.


What needs to be done

The U.S. meteorological community and others need to speak loudly to Air Force management, the current administration, Congress, and others to stop this ill-advised AF action.  The damage to the U.S. weather prediction capacity and AF weather prediction will be substantial if the proposed plan is followed.  There is time to turn this around and restore a rational approach to weather prediction modeling the in the Air Force.   Here in Washington State, I hope our Senators, Patty Murray and Maria Cantwell, will intervene.


April 19, 2015

Siberian Smoke Reaches the Northwest

Few things communicate the environmental interdependence of our planet better that the movement of Asian pollution across the huge Pacific Ocean and its impacts here in North America.

And we have had a good demonstration of this long-range transport during the past few days, as smoke from huge fires over southern Siberia  have wafted across the North Pacific, producing hazy skies and enhanced sunsets/sunrises over the U.S. West Coast and western Canada.

We don't think about it very much, but the air we breath in Seattle today was over Asia 3-7 days ago.

Yesterday morning , I was walking with a friend along the Sound and the reduced visibility of Rainier and other features was striking.   An image from the UW web cam yesterday afternoon illustrates this.  Sunrises and sunsets have been accentuated with enhanced red colors--a good sign of smoke.

Western Asia has been an environmental problem zone the past week.   The initiator of the problems was a strong low center that moved eastward over Siberia, producing strong winds over the region (see weather map with sea level pressure and 5000 ft  above sea level wind speeds  for 1200 UTC April 15th).  The colors show wind speed and greens are winds about 40 knots.


Some farmers in Siberia prepare their fields by burning debris from the previous year and unfortunately the winds caused the fires to burn out of control, causing a massive conflagration that has killed at least 30 people, destroyed thousands of homes, and created a huge smoke plume.


The same strong winds have picked up dust and sand in Mongolia and northern China, resulting in one of the worst dust /sand storms around Beijing in years.


NASA satellites have documented both the fires and the smoke/dust rising up over Asia and have tracked it crossing the Pacific.   This image from April 14th shows the fires and if you look closely you will see the smoke plumes (greyish shading in contrast to the clouds, which are more white).


Here are a sequence of NASA images showing clouds and the smoke (colored), starting over Asia and moving our way.  You can see the substantial value of NASA satellites that observe our atmosphere at many wavelengths, showing everything from clouds and precipitation particles to aerosols and pollution.


Not convinced of the Asian origin of our air the last few days?   Well, to confirm the above hypothesis I ran an air trajectory model (NOAA Hysplit) to see where the air over us come from.
Specifically, I found the origin of the air at 11 AM Saturday ending over Seattle at three levels: 1000, 2000, and 3000 meters above sea level (shown by red, blue, and green lines in the figure).  Our air came from Asia, with the air ending at 3000 meters above us (roughly 10,000 ft) starting OVER SOUTHERN SIBERIA.


Air quality data at the surface over our region has shown little impact, suggesting most of the Asian smoke has stayed aloft.


April 17, 2015

The Meteorology of the Solar Power Revolution

There is a quiet revolution in energy production that will change the lives of many:  the solar energy revolution.

With the cost of photovoltaic solar systems dropping rapidly, there has been a rapid expansion of solar power installations, both commercial and residential, around the U.S., with particularly rapid growth in California.

Consider the geographical distribution of the resource:  where are the best locations in the U.S. for solar power?

By considering both solar angle, cloudiness, and other factors,  NREL (National Renewable Energy Lab) has produced solar energy resource maps for the U.S.   Here is the annual average values (per day in kilowatt hours per square meter).   The southwest U.S. is the Saudi Arabia of solar energy, with the highest values stretching from western Texas to California.    It is really better than Saudi Arabia, since there is huge population hungry for energy  in the Southwest (e.g., Los Angeles, San Diego, Las Vegas, Phoenix, Tucson, etc.)  Lots of sun during the day, exactly when folks need it for air conditioning and their daily lives.
There are, of course, two main factors than produce this geographical distribution.  First, annual solar radiation increases towards the equator.  But more importantly there is the distribution of cloudiness with the desert SW have less clouds (see map)

For us here in the Northwest, there is substantial solar energy potential over eastern Washington and Oregon.  This is particularly true during the summer months when our region enjoys clear skies and LONG summer days.  To illustrate, here is the solar resource for July.  The Columbia Basin is world class, as good as California.

There is a factor that enhances the NW solar energy potential, making up a bit for the fact we are relatively far north:  our temperatures.    It turns out the photovoltaic cells are sensitive to temperature, with efficiency greater at COOLER temperatures.    Thus, high temperatures in the

desert southwest works against solar cell efficiency.  But cooler temperatures makes our solar panels more efficient, partially leveling the playing field for us a bit.

The amount of solar energy being produced today is far greater than many people think, particularly in California, the U.S. state with the most installed solar units.  Here is a plot of the renewable energy output for California yesterday (April 16, 2015).  Solar energy is the dominant source of renewable energy during the daytime hours.


But here is the amazing thing.  The next plot shows total energy production yesterday in CA from all sources.  Renewables (mainly solar) are roughly 25% of the total energy production during the day--and this does not include solar production at individual homes!


But what about here in cloudy Seattle?   It turns out that solar energy from photovoltaics can make sense for local residents, particularly with all the Federal, State, and local subsidies.   One of the faculty members in my department installed a solar system two years ago.  He finds that for the sunny six months of the year be pays nothing for electricity AND produces enough juice to charge his Chevy Volt for all his local driving.  His estimated payback period is 7 years.   Even without subsidies his solar array would make financial sense.  Electric cars are a perfect adjunct to solar energy, allowing excessive power to be stored in the car's batteries for transportation and other uses. Warm climates like the U.S. Southwest are also good since energy demand (for air conditioning) is closely related to solar output.

The U.S. is hardly tapping it potential for solar energy, and with supportive policies U.S. solar generation could easily be 10 times larger than today in ten years, supplying 10-15% of all U.S. electricity demand, and much more in the solar rich regions like the southwest U.S.  These are conservative numbers--I bet we could do much better.

There are several firms, with meteorological modeling and statistical expertise, that supply solar energy forecasts for industry and others.   One of the biggest is here in Seattle:  3-Tier/Vaisala:


In short, solar energy collection is growing rapidly today, but is only a shadow of what it could be, particularly since prices are dropping rapidly and the technology is progressively improving.

Should I Let AI Write My Blogs?

I spend a lot of time thinking about and writing my blogs.   Could AI apps do the work for me?   Could any of you tell the difference? Well,...