February 28, 2015

Lions, Lambs and March Weather

There is the old saying that March comes in like a lion and goes out as a lamb.

In other words, March starts out cold and stormy, but by the end of the month the weather has warmed and moderated considerably.

But is that true here in the Northwest?   Is it true anywhere in the U.S.?    This critical question will be answered in this blog.


Since this blog is dedicated to a scientific approach in all matters, we will quantify this issue by devising a LionToLamb (LTL) index at locations around the U.S.  The LTL is the difference between the April and February temperatures at a weather observing site:

LTL= Average April Temperature - Average February Temperature

If April is much warmer than February, the weather is undergoing a substantial lion to lamb transition in March.

So let's examine the evidence.  Here are the LionToLamb numbers for major cities in the U.S. in degrees F.   You will note that very large LionToLamb transitions (greater than 20F) are limited to the Upper Plains and northern Midwest.   For these folks,  the approach of spring is a big deal.

Moderate LionToLamb numbers are evidence over the Northeast the northern portions of the SE U.S. and into the high Plains from Montana into northern Texas.

Where is the LionToLamb transition very weak, so that spring is only evinced by weak, gradual warming?  The answer: the Pacific coastal zone where the index ranges from 6.9F in Seattle to a measly 2.8F in Los Angeles.   Spring is much more noticeable east of the Cascade crest.

Spring is really not a dramatic season west of the Cascade crest as illustrated by a plot of climatological temperatures at Seattle Tacoma Airport (average highs and low shown by red and blue lines).

You can see the problem by looking at the climatological temperatures at about 3000 ft (925 hPa pressure)  for the nearest radiosonde sounding location  to Seattle (Quillayute on the Washington coast).  The black line shows the a average temperatures at this lower-atmospheric level.  No increase until roughly mid-April!  The red and blue lines are the record high and low temperatures at that site for those days.


Contrast this with the temperatures at the same level at Minneapolis (MPX).  Major warming in March.   Lions transform to lambs!


Why don't we have a major Lion to Lamb transition in March along the West Coast?    One major reason is the Pacific Ocean, which greatly moderates our temperatures year round.  Since we never get that cold, we don't get a major warm up when the sun revs up.   In essence, the Pacific acts as a big temperature flywheel.

But there is more.  In Spring, our flow generally transitions from southerly (originating over warmer water to our south) to westerly and northwesterly flow (from colder climes).   This slows down the warming considerably.  

Let me illustrate this.   Here are the average winds near the surface (1000 hPa) in February. Southerly flow over the coastal Northwest, but northwesterly low over the upper plains.
In April the winds over the eastern Pacific are more westerly (and thus passing over colder water), while southerly winds are pushing up into the Midwest.   

The bottom line:   the old saying about March weather goes from a lion to lamb is really not true in western Oregon and Washington, as well as coastal BC and California.   Perhaps we should say that in the Northwest "March comes in as a goat and goes out as a sheep."    Or perhaps  "in July, sun glasses must buy."   Or "in June, beware the gloom."  

I better stick to numerical weather prediction and let others deal with witty aphorisms.

February 26, 2015

Strong Winds, Coal Dust, and the Proposed Gateway Pacific Coal Terminal

A major coal export terminal has been proposed at Cherry Point, on the Strait of Georgia northwest of Bellingham (see map).   Known as the Gateway Pacific Terminal (GPT), this proposed facility would offload large quantities of coal from rail cars into huge coal piles and then load the coal on to waiting ships.   We are talking about millions of tons of coal per year.
A major issue is whether winds will lift coal dust from this facility and then distribute the coal particles into the natural and human-occupied environment.  There is good reason for concern about this, with coal dust storms coming off the Canadian Westshore coal port when the wind picks up (see the image below).  The Westshore coal export facility is just north of the border (see figure) in a location that is far less windy than the proposed Cherry Point/GPT site (more on this later).

Coal dust blowing from the Westshore coal terminal, British Columbia, April 2012. Photo: Jerry Bierens, Delta Optimist.

The proposed GPT site will include large hills of coal delivered by 10-20 coal trains per day.  Will winds be sufficient to create coal dust storms as shown above?

To study the wind issue at the proposed Cherry Point site, UW undergraduate Ryan Clark and I  have examined the nearby wind observations, with support from a local non-profit organization (Research Now).   A summary of our findings can be accessed here, but I will summarize them in this blog.

 We looked at roughly five years of  6 minute or hourly wind data, mainly at two sites: the south pier near the BP Oil Refinery and a land site near the BP storage facility. The former site is maintained by NOAA's National Ocean Service and the later by the Northwest Clean Air Agency.  The proposed GPT coal pier is also shown on the map.


Strong winds are not unusual at the pier locations, something that is illustrated by the summary of the south pier wind speed data, shown below.  Keep in mind it takes winds of 20-30 mph to raise significant dust.  Winds that are probably strong enough to raise some dust occurred about 5 percent of the time, with winds certain to raise coal dust (33.6 mph and more) about .5% of the time (9 days over five years).

A nice way to summarize the winds at a location is something called a wind rose:  one for the south pier is shown below.  This plot shows the frequency of winds (in meters per second, multiple by roughly two to get knots) from various directions, with the shading indicating the frequency of various wind speeds.  The inner circle indicates 2% of the time, the middle circle 4% of the time, etc. The most frequent strong winds at this site are from the south-southeast, but there are also many strong winds from the northeast.   These are the winds blowing of the of the Fraser River valley, a major gap in the Cascades (see terrain map above).  A secondary peak is from the northwest.

The winds just inland at the BP land site (which should be similar to the proposed coal pile locations) is described by the wind rose below.  Quite a bit different; over land the winds are reduced (water is aerodynamically smooth compared to land surfaces) and the northeast winds coming out of the Fraser River Valley are much more prominent (perhaps 10-15% of the time).


A key issue for the proposed coal terminal site is that it is at ground zero for the northeasterly winds coming out of the Fraser River Valley--the positioning could not be worse.  And every few years there are extreme events, when the winds gust to 30-70 mph--which would play havoc with the coal piles.  For example, an event in December 1990 brought winds exceeding 30 meters per second (60 knots) over the proposed coal terminal.
 Want to see a video showing you what a strong SE blow in the Bellingham area can look like?  Click on the image or the link:


So strong winds will either blow the coal dust out into the Strait of Georgia, polluting the waters, or send the particles toward Vancouver (in SE winds) or towards Bellingham (NW winds) to influence the human population.   Blowing coal dust right over the prime habitat of the endangered southern resident killer whales, which are protected under both the Marine Mammal Protection Act and the Endangered Species Act.

And it is worse than that.   The proposed facility will use water sprayers (misters) to keep down the dust.  But the strong NE winds are virtually always accompanied by cold, below-freezing temperatures, which would freeze up the sprayers.

But there is more!  The incessant coal train traffic will tie up road traffic in the Puget Sound region as the trains block crossings in Seattle, Edmonds, and Everett (among other locations), with an substantial economic cost that will more than negate the few permanent jobs this project creates.   The coal ships and the trains coming and going will worsen regional air pollution, as will the combustion products produced in Asia when the coal is burnt--gases and particles that will waft their way across the Pacific back to us.

Heading our way

And the huge amount of coal burned as a result of this project will make a large contribution to global warming, outweighing everything done in our region to reduce our carbon footprint.

So how many ways can you spell environmental disaster?   And for what?   To help out Wyoming and Montana make some extra cash?  Increase the profits from some foreign coal companies?  We end up with profoundly negative impacts to our environment and economy and gain nothing in return.  Global warming is substantially worsened. Our roads get tied up and our air quality declines.

Stopping this irrational project should be the goal of a bipartisan coalition in our state since nearly  everyone will lose if it goes through.  Bad for business, bad for the environment, bad for traffic, bad for health.


February 24, 2015

The Winter Without SAD (Seasonal Affective Disorder)

Although there have been complaints about the lack of snowfall, there is a substantial silver lining to this winter: lots of sun.   Frequent, glorious sunshine even during the mid-winter months.  One of the sunniest winters in recent memory.


And my own observation is that folks in Seattle have been a lot more cheerful and happy this winter as a result. Normally, many people complain about midwinter blahs, often known by the imposing name of Seasonal Affective Disorder (SAD), with conversations edging towards comparing light boxes and mid-winter trips to sunnier climes.

But not this year.   People go on and on about the sun, about the high pressure, and whether this is some kind of climate-change omen.

So what has been going on?  Let's take a look at the solar radiation measurements of  this winter (Nov-January) compared to two years ago at the WSU Agweather site in Seattle.  The monthly amounts are in MegaJoules per unit meter squared (such terminology will impress your friends).  It is evident that we had a lot more solar radiation this year than two years ago.


Or consider the station in Woodinville, WA.  Let's looks at the solar radiation there last month and the previous January's in MJ/square meter

2015  113
2014  105
2013  101
2012  83
2011   79

More sun in 2015.  A lot more than 2011 and 2012.

This has been the winter of the big West Coast ridge, with extended periods of precipitation-free, sunny skies, interrupted by short periods of heavy rain.   The following plot of the precipitation observations at Seattle Tacoma Airport shows this clearly.  The blue line is the typical amounts and red line is the observed.  They show the CUMULATIVE amounts over the last 12 weeks. The horizontal plateaus indicate dry periods.
The question you are all asking:  will we have more sun?   Is there a pay back for our beautiful weather?  A cloudy yin for our sunny yang.

The answer will warm your heart.

First, the sun is getting much stronger now and the days far longer.  So even if clouds are around, there is more light.  It is rare to get major storms after roughly February 25th.  I mean big lowland snowstorms, windstorms, or floods.  Meteorological spring is here.

As I noted in an earlier blog, the ridge has not gone away, just shifted a bit westward.  The upper level map for 1 AM Monday illustrates this.  This ridge position allows weak disturbances (troughs) to pass southward through the Northwest.   But these troughs will only bring brief periods of clouds and precipitation (roughly a day) before sun comes out again.   In fact, this weekend looks sunny.


Finally, here is a high-tech ensemble-based prediction of cloud cover over Seattle from the North American Ensemble Forecasting System (NAEFS).  Cloud cover goes from 0 to 10 (completely cloudy) and the dates are on the bottom.  The horizontal black line shows the median (middle) value of the ensemble of forecasts.   We have a cloudy period coming on Thursday and Friday, followed by sun over the weekend.  Ups and downs, but we don't stay clouded in for long.


And one more measure of the warm, sunny nature of this winter.  I had to cut my lawn last weekend, something I have never done this early before.

Rider Oasis Questionnaire

A group of bicycle enthusiasts are developing the idea to place convenient kiosks around the city with items of interest to cyclists.  They have a questionnaire available on their website.  Please take a look and give them feedback if you have a minute...thanks.


The Pacific Northwest Weather Workshop
Interested in attending the big local weather workshop of the region?  The Pacific Northwest Weather Workshop will be held in Seattle at the NOAA facility on February 27-28th.   Everyone is invited and the majority of talks are accessible to laypeople.  To attend you have to register or they won't let you in the gate.  There will be a major session on the Oso landslide.  There is a registration fee that covers refreshments and food, and special student pricing.  If interested, check out this website.


February 22, 2015

The Ridge Begins to Shift

This has been the winter of the ridge, an area of high pressure in the in the lower to mid atmosphere that has brought us consistently warm temperatures.   Downstream of our persistent ridge there has been a trough over the eastern U.S. that given them unending cold and snow.

But the ridge is shifting, with substantial implications for our weather in the Northwest.

Let me remind you of Ridge 101.  The plot below shows a situation with a ridge over the western U.S.  The color shades are the heights of a pressure surface (in this case 500 hPa).  Where the higher heights push northward, there is a ridge, pushed southward--a trough.   When the ridge is over us (like in this figure) we are generally dry.  During most of the year, we are also warmer than normal when the ridge is overhead (but during the middle of winter sometimes we can be engulfed by fog at low levels).  East of the ridge there is northwesterly flow, bringing cold air from the north.   If a disturbance is embedded in this NW flow, we can have precipitation--yes, even snow.  On the western side of the ridge, there is southwesterly flow:  warmer than normal temps and usually wet.  This is when we get the atmospheric rivers, with heavy precipitation.


This winter we have gone between having the ridge over us (dry, and often a bit warmer than normal) to brief situations when the ridge slipped a bit eastward, give us warm, wet conditions.   As a result, we have had an overall warm winter, with normal precipitation.   Rarely, has the ridge slipped west of us, putting us in the cooler flow.   

But that is going to change.

Let's see how things have evolved and will evolve this week by looking a series of upper level (500 hPa maps).

First, last Monday at 10 PM PST.  Big ridge over the coast, but most of the northerly flow is to the east of the region. (winds are parallel to the lines, where lines are closer together, the winds are stronger, higher heights to right of the winds).  The jet stream is associated with the large gradients in the heights, with the jet stream being the conduit for weather disturbances.

 Saturday at 4 PM.  Looks familiar?  But there has been a subtle westward shift of portions of the ridge and northerly flow is working its way into eastern Washington.   Temperatures have cooled a bit...and there was even some frost in my neighborhood this morning.

 Fast forward to the prediction for Wednesday morning.  The ridge has broadened and shifted to the west.  Disturbances (troughs) are getting around the ridge on its northern flank.

 And by Friday AM, the ridge has strengthened offshore and we are now on the cold side of the jet stream

So we are not only moving into cooler air, but are now vulnerable to feeling the effects of weather disturbances embedded in the northwesterly flow.    This is good for mountain snow lovers.

On Thursday/Friday a disturbance WILL reach our region.   Here is an upper level map for Friday at  one AM;  you can see the upper level trough over us and the big ridge offshore.


Thw 48 hr total precipitation ending 4 PM on Friday is shown below.  Modest amounts, particularly over the western side of the Cascades (1-2 inches)


And there will be snow, as shown by the 48h snowfall totals over the same period (6-8 inches in the Cascades) and even eastern Oregon gets whitened up.  Not a game changer, but helpful.


It is not unusual for a late winter weather regime change, particularly for years with dry/warm mid-winters.  It doubt we will make up for the abysmal snowpack, but we may be able to mitigate the situation at the end.

Rider Oasis Questionnaire

A group of bicycle enthusiasts are developing the idea to place convenient kiosks around the city with items of interest to cyclists.  They have a questionnaire available on their website.  Please take a look and give them feedback if you have a minute...thanks.

The Pacific Northwest Weather Workshop

Interested in attending the big local weather workshop of the region?  The Pacific Northwest Weather Workshop will be held in Seattle at the NOAA facility on February 27-28th.   Everyone is invited and the majority of talks are accessible to laypeople.  To attend you have to register or they won't let you in the gate.  There will be a major session on the Oso landslide.  There is a registration fee that covers refreshments and food, and special student pricing.  If interested, check out this website.

February 20, 2015

Whatever Happened to El Nino?

Last year, the media couldn't stop talking about a coming super El Nino.

Then just a regular El Nino.

And now they just don't talk about it anymore.

Good reason... the famed El Nino has flamed out, and its impact on NW weather is minimal at best.

El Ninos are associated with substantially warmer than normal water in the eastern tropical Pacific. Meteorologists pay particular attention to the sea surface temperatures (SST) in the Nino 3.4 area (see map below)


Here is the plot of the SST anomalies (difference from climatology--or normal).  After peaking to a modest 1C, it is dropped to about .5.


NOAA has put a lot of buoys out in the tropical Pacific that are capable of measuring water temperatures below the surface.  As shown by the following plot, cooler water has become established under the eastern Pacific. (The figures has depth on the  y-axis and longitude on the x-axis, crossing the Pacific from west to east).  Not suggestive of an El Nino.


The latest NOAA probabilistic El Nino forecast give a probability for El Nino of around 55% now and that declines over time, with a nearly equal chance of  experiencing a neutral year, when SSTs are near normal


With a no-show El Nino this year, the associated atmospheric circulation patterns have not occurred, like a weakened equatorial trade wind and heavy rains over southern CA.

Instead of an El Nino pattern, high pressure has locked on the west coast and that will certainly be the case this weekend as a huge ridge will redevelopment, configured in the classic "omega" pattern:


February 18, 2015

The Winter of 2070

There is a fascinating aspect of our present anomalously warm/snow-free winter.

It is very similar in many ways to what will be experienced in an average winter about a half-century in the future --more so than any recent year I can think of.


Hurricane Ridge (5200ft) on Monday Afternoon

As you all know, this winter has been much warmer than normal.  Here is the difference of the average temperature of the last 90 days from climatology (1980-2009).  Roughly 4F warmer than normal over the Northwest.

The UW Climate Impacts Group has published a report outlying their prediction of the future Northwest climate.  Here is a figure from that report showing predicted temperature change (relative to 1960-1989) with time.  They show the warming from various scenarios or RCPs (Representative Concentration Pathways).  RCP 8.5 (solid red line) is the most aggressive.   For reasons that I won't go into, many of my climate colleagues believe it it too aggressive and the RCP 4.5  (blue line) will prove closer to what will happen.  A number of climate model simulations were made, with the solid lines being the average of many runs (the range of these simulation is shown by the lighter lines).

Reading off the graph, it looks to me that a 4F warming from the end of the 20th century would occur around 2070.  If we choose the more aggressive RCP 8.5 scenario the answer would be a bit earlier (say 2050).


What about precipitation during the past 90 days?   This figure shows that the precipitation this year has been close to normal over most of the Northwest.  This is similar to what the climate models are suggesting for later in the century.

The snow pack is now running about 30-40% of normal, less in some places, more in others (see figure).  Similar to what a number of regional climate models are suggesting for around 2070.


So forget about checking out time machines or reading dry scientific reports on the future climate of our region.   You are living it right now, experiencing the conditions that will be typical 60 years in the future. 

We will have enough water 60 years from now for the urban populations, but skiing will be lousy at the lower elevations.  Snoqualmie Summit will be memory as a skiing venue.   And quite honestly, the winter temperatures will be more pleasant around here.   But the lack of snow, will bring serious consequences:   it will be bad for fish and there are serious problems for the Yakima agricultural area. This summer will be an interesting test of how our region deals with a very low snowpack that will be common late in the 21st century.    Keep in mind that winter is not over yet and the models are suggesting a major weather regime change late in the month, towards a wetter and colder pattern.


You don't need this...you are already in the future.


The Pacific Northwest Weather Workshop

Interested in attending the big local weather workshop of the region?  The Pacific Northwest Weather Workshop will be held in Seattle at the NOAA facility on February 27-28th.   Everyone is invited and the majority of talks are accessible to laypeople.  To attend you have to register or they won't let you in the gate.  There will be a major session on the Oso landslide.  There is a registration fee that covers refreshments and food, and special student pricing.  If interested, check out this website.

KPLU Climate Talk (SOLD OUT, but there is a waiting list)

If you want to hear me talk about the regional implications of global climate change in some detail, please come to my UW Kane Hall talk on March 11th.Sponsored by local public radio station KPLU, tickets for this event can be secured at this web site.

February 16, 2015

The Origin of this Winter's Weather Anomalies: Is There A Global Warming Connection?

In my previous blog, I talked about the anomalous and persistent high pressure/ridging that has dominated the western U.S., producing generally dry and warm conditions.  And the equally persistent, and directly connected, low pressure and cold influencing the eastern U.S.

In this blog, I will spend some time examining the claims that global warming is behind it.  A final blog will discuss the true origins of the western North American ridging.


 Hurricane Ridge (5200 ft) in Washington Olympics is snow free, while Boston has several feet.

As I explained 
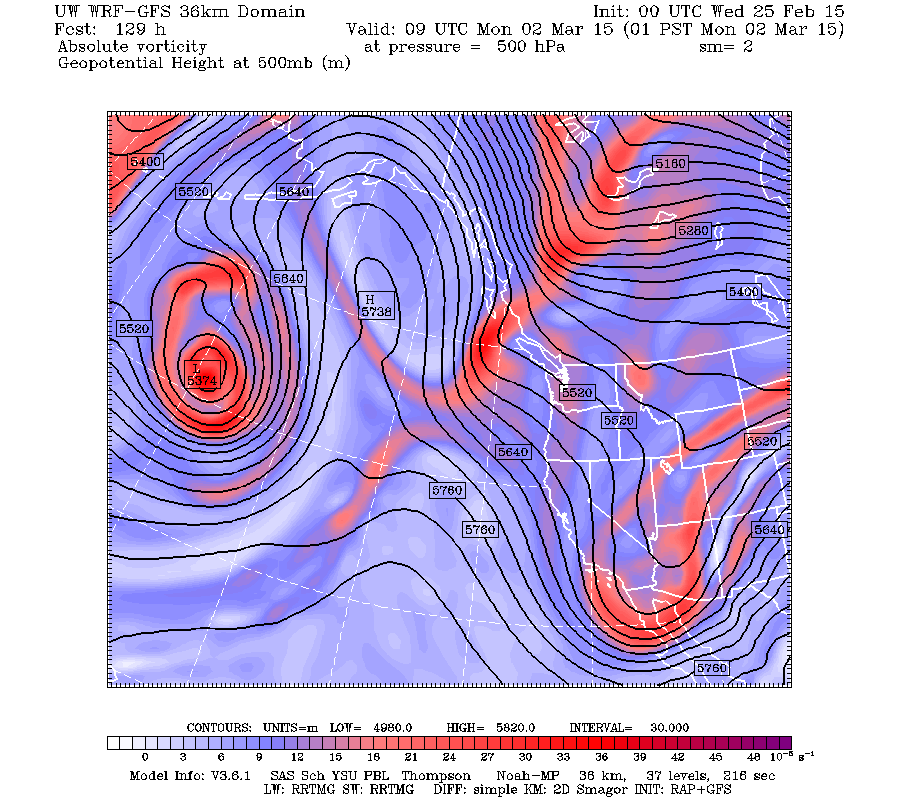
in my previous blog, the proximate reason for the anomalous weather is clear:  the highly amplified upper-level wave pattern with a major ridge over the West Coast and a trough over the eastern U.S.   Thursday evening's  (10 PM PST) 500 hPa upper-level chart  (top figure) shows the story.  The colors are heights (like pressures) and solid lines are sea-level pressure.  Higher heights bulge up in the west and lower height over the eastern U.S.  The lower picture shows temperatures in the lower atmosphere (around 5000 ft) at the same time.  Warm (yellows) in the west, cold (blue/purple) in the east.


So the amplified waviness of the upper level flow (and the associated jet stream) is what is making it warm in the west.   It is not due to any kind of uniform global warming over the planet.   The East Coast is as anomalously cold as we are anomalously warm.

The next question is obviously: is this amplified upper level pattern and couplet of warm-west and cold-east the result of global warming due to anthropogenic greenhouse gases or is it mainly natural variability?  I believe the facts and peer-reviewed literature suggest the latter, but you be the judge from what I will present below.

The most influential paper suggesting a global warming origin is by Jennifer Francis and Steve Vavrus:

Francis, Jennifer A.; Vavrus, Stephen J. (2012). "Evidence linking Arctic amplification to extreme weather in mid-latitudes". Geophysical Research Letters


In this paper they claim that global warming will weaken the jet stream by warming the Arctic, reducing the temperature gradients that drive the jet stream.  They hypothesize that a  weakened jet stream undulates more, producing a more amplified wave pattern with more cold waves in the eastern U.S. in the winter.  The media has given this paper huge play and it has been heralded by major political figures, like the President's Science Adviser, John Holdren.  And many environmentalists want to believe this paper is correct.

Unfortunately, the paper is deeply flawed and most members of the research community acknowledge it.    First, the Francis/Vavrus method of determining the amplitude of the waves was incorrect.  Instead of measuring the daily values of wave amplitude, they mistakenly used seasonal excursions.  A paper by Elizabeth Barnes of Colorado State University did the calculation correctly and found no trends in wave amplitude.

Furthermore, there is no reason to believe the upper tropospheric jet will weaken under global warming since increased CO2 enhances warming of the upper tropical troposphere, increasing the north-south temperature gradient, thus strengthening the jet.  Combined with the weakened gradient at low levels, this appears to result in jets with little change.  In addition, even if Francis/Vavrus were right that the jet was weakening, theoretical research is emphatic that this would deamplify the wave pattern and not strengthen it.

You want more?   There is no sign that cold waves have been increasing in the eastern U.S. as Vavrus/Francis claim;  in fact, they are declining.  And global climate models run under large increases of CO2 do not show the amplification that Francis/Vavrus claim.

Anyway, this Francis/Vavrus hypothesis is clearly wrong, but the media and some environmentally minded folks can't seem to let go of it.

More recently, the media and others have liberally cited another paper by some folks at Stanford to back the global warming/West Coast ridge connection.


Written by Daniel Swain and others, this paper starts by making the case that the drought and west coast ridging is historically very unusual. This is entirely correct.   So unusual and such an outlier, that great care needed to be taken in suggesting this was the result of progressive global warming of the past decades.

Then they compared climate model simulations for a pre-industrial era and the late 20th century regarding the amplitude of west coast high pressure at particular locations and found that it had increased;  on this basis, they suggested that anthropogenic CO2 is increasing pressure/heights making extreme values more likely.    This is, of course, true.  If you warm the atmosphere, the heights of pressure surfaces (like 500 hPa) will rise.    But this says NOTHING about troughs and atmospheric ridges, because they are associated with gradients of heights, not absolute values.

Lost you on this?   A ridge or high pressure area is only important because heights or pressures are lower in adjacent areas.   So for a ridge to become important and influence the weather, height must rise more in the ridge than elsewhere.  They did not show that and to be fair to them, they admitted this in the paper and back-pedaled in their conclusions.


So basically, their work DOES NOT LINK GLOBAL WARMING to the drought or enhanced high pressure areas along the coast.  But that did not stop the media from saying so.  In fact, Stanford's PR office was pushing this angle.


 Finally, there is apaper by Wang. et. al in Geophysical Research Letters (2014) that is being heavily cited in the media as proof that mankind is enhancing the western U.S. ridging:


In this paper,  the authors come up with a "dipole index" that measures the amplitude of the trough/ridge pattern.  Their results showed that 2013-2014 was very unusual, but if you look at their graph you will see that there is absolutely no trend, as one would expect if progressively global warming was the cause:
From GRL, Wang et al., 2014, page 3222

 Then they discuss the anthropogenic influence of human greenhouse gas emissions on the dipole amplitude.  Strangely, they examine how the variance (variability) of the dipole changes in time not the critical pattern of ridging on the west and troughing in the east.  They find that using analyses based on observations (the 20th century reanalysis from NOAA) that there is little trend in variance since 1950 or since 1975 when satellite data started to become available.   So this would really indicate that the real atmosphere is not changing.

But then they ran single climate simulations with and without greenhouse gases and found the variance increases with CO2.  What these single simulations mean and their relevance to global warming's impact on the west coast ridging is uncertain, but this did not stop them from claiming:

"there is a traceable anthropogenic warming footprint in the enormous intensity of the anomalous ridging during winter 2013-2104."


The bottom line is that a careful reading of any of the papers claiming an anthropogenic origin of the amplified upper atmospheric waviness reveals that they all have major flaws.  Or the media has hyped them beyond recognition.   I don't know of any leading atmospheric scientist that is claiming such a relationship.  But that has not stopped the media from hyping the connection.


There are, in fact, a number of papers that provide a different view, that the origin is from natural variability.  For example, in the same issue as Swain et al, a paper by Funk et al looked at a large collection of climate model simulations and concluded that global warming had no impact on the  West Coast ridging:


And as I mentioned in my last blog, a report by leading NOAA scientists have said the same thing:  the West Coast ridge is probably the result of natural variability.  There is no absolute certainty, of course.

Global warming is a serious issue, but we must keep it in perspective in comparison to natural variability.

In my next blog on this topic I will examine the results of recent papers that show the dominance of natural variability in producing the West Coast ridging.


KPLU Climate Talk

If you want to hear me talk about the regional implications of global climate change in some detail, please come to my UW Kane Hall talk on March 11th.Sponsored by local public radio station KPLU, tickets for this event can be secured at this web site.

The Pacific Northwest Weather Workshop

Interested in attending the big local weather workshop of the region?  The Pacific Northwest Weather Workshop will be held in Seattle at the NOAA facility on February 27-28th.   Everyone is invited and the majority of talks are accessible to laypeople.  To attend you have to register or they won't let you in the gate.  There will be a major session on the Oso landslide.  There is a registration fee that covers refreshments and food, and special student pricing.  If interested, check out this website.

Should I Let AI Write My Blogs?

I spend a lot of time thinking about and writing my blogs.   Could AI apps do the work for me?   Could any of you tell the difference? Well,...